Stop Pouring Water Into a Leaky Bucket: The 2026 Strategy to Lower Blended CAC
Your Meta dashboard has one answer for flat revenue. Spend more.
That answer worked when auctions were cheap. In 2026 it buys you expensive clicks that land on a store which converts at 1.1 percent, then leave. Our audits of more than 50 Shopify stores across the UAE and GCC put the median conversion rate at engagement start at 1.1 percent, with desktop converting at roughly double the mobile rate. Pouring budget into that gap does not fix the gap. It prices it.
This post makes one claim. Buying traffic for a store with a poor conversion rate is leakage, and fixing the store is the only move that lowers blended CAC without asking Meta or Google for permission. For the full funnel this sits inside, start with the complete Shopify CRO guide. If traffic is up while sales sit flat, the sibling diagnosis in /guides/why-shopify-traffic-doesnt-convert maps traffic quality to funnel leaks.
Why does buying more traffic raise your CAC instead of fixing it?
Because CAC is a fraction, and founders keep paying to grow the numerator.
Every extra dirham of ad spend adds cost before it adds customers. When the store converts 1 percent of clicks, 99 percent of each budget increase goes to visitors who never buy. Meta CPMs rose more than 40 percent between 2021 and 2025 across competitive DTC categories, so each new click costs more than the last while converting at the same thin rate. The blended number moves in one direction. Up.
The trap response is familiar. Revenue dips, the team raises daily budgets, ROAS wobbles for a week, then settles lower than before. Nothing about the store changed. The ad account now needs cheaper clicks to hit the same CAC, and cheaper clicks do not exist in an auction that gets pricier every quarter.
There is a contrarian sentence worth sitting with. You do not have a traffic problem. You have a conversation problem that traffic makes expensive.
The store is the conversation. The ad shouts the promise, the product page must finish the sentence, and most pages never do. The founder knows the selling point. The ads hint at it. The homepage talks features and lifestyle, and the visitor leaves with the feeling that something was good but nothing made them need this store. That is the mute offer we describe in our Delta framework, and paid traffic amplifies it at full price.
What does the 1 percent to 2 percent math do to your margin?
It cuts your CAC in half without touching your ad account.
Take a clean hypothetical. You spend $10,000, you buy 5,000 clicks, your store converts at 1 percent. That is 50 customers at $200 each. Same spend, same clicks, conversion at 2 percent. That is 100 customers at $100 each. No new creative. No broader targeting. No discount. The denominator did the work.
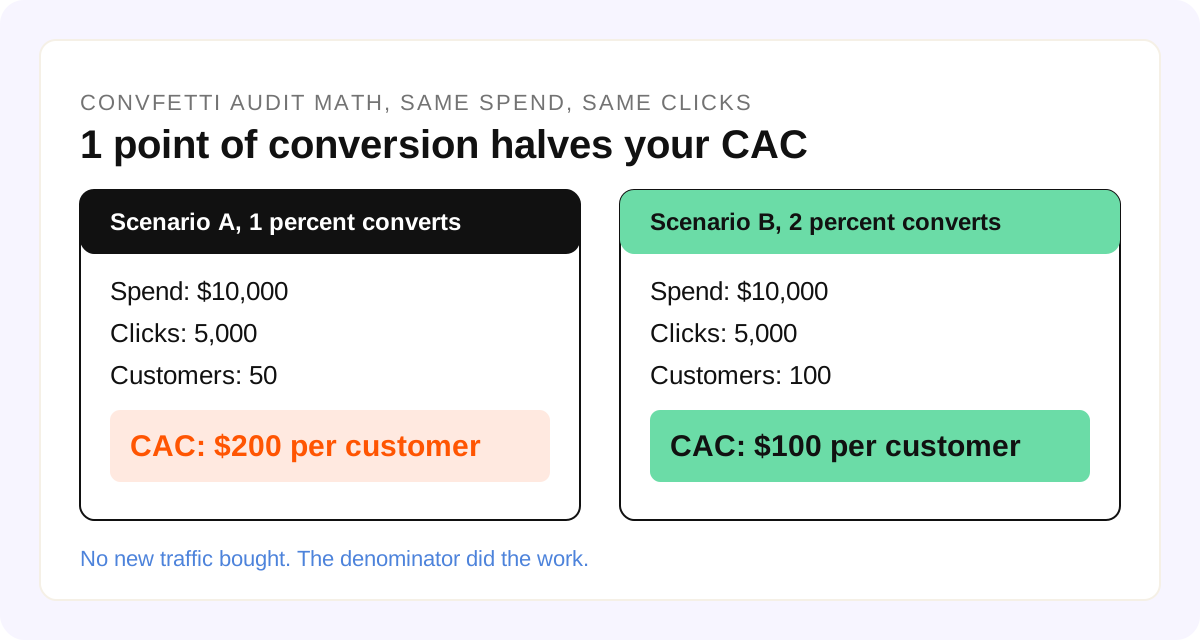
This is why we call CRO margin insurance. Each point of conversion shifts money away from ad platforms and into contribution margin. The cash stays inside the business whether you scale spend or not.
The second effect compounds the first. A store that converts better supports higher bids. Average order value rises with post purchase upsells, repeat purchase rises with a clearer offer, and lifetime value follows. Suddenly you can afford the auction price your competitors complain about, because each click is worth more in your store than in theirs. They optimize bids. You optimize what the bid buys.
The third effect is permanence. Ad performance stops the day you cut budget. A fixed checkout, a thumb friendly buy box, a stated COD fee, these live in your code and convert every future click. Paid traffic is rent. Conversion fixes are the building.
Where do Shopify stores leak the most revenue?
Three places cause most of the damage. Measure them in this order.
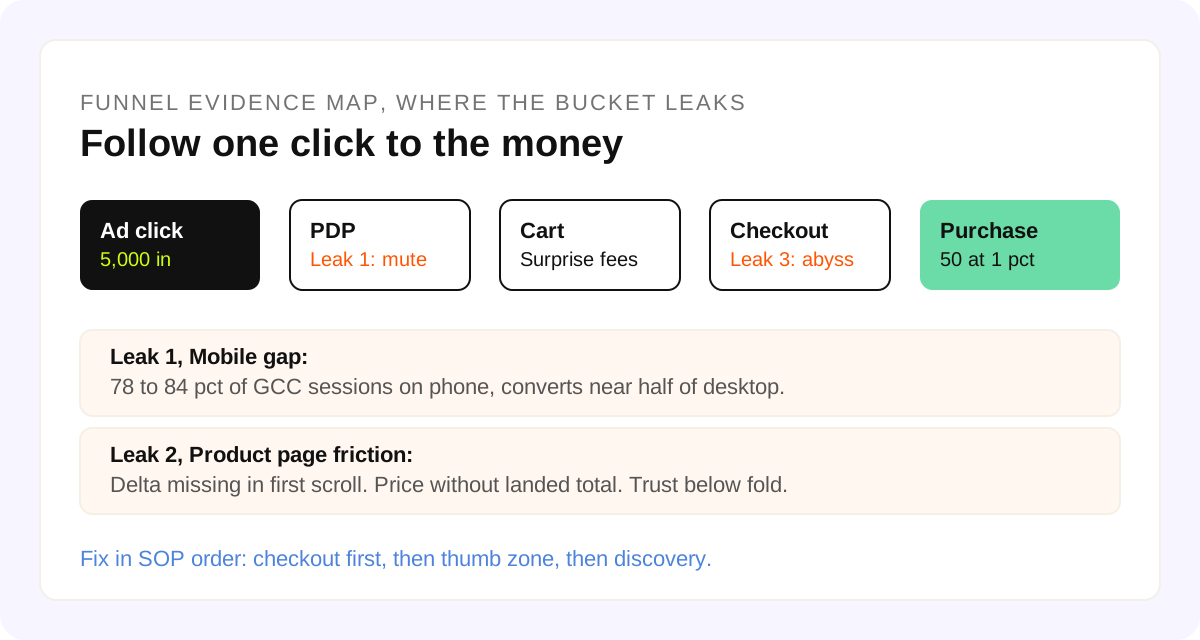
Leak 1: the mobile gap. In our GCC audit set, mobile drives 78 to 84 percent of sessions while converting near half the desktop rate. A typical split is desktop at 2.1 to 2.8 percent against mobile at 1.0 to 1.4 percent on identical traffic. Baymard Institute research across 13,000 checkout sessions puts global cart abandonment at 70.19 percent, with 32 percent of mobile users reporting difficulty completing checkout from layout and form issues alone. When four of five visitors arrive on phones, phone friction is your conversion rate.
Leak 2: product page friction. This is where the mute offer costs real money. Shoppers land from an ad that promised one thing, then meet a page that never states why this store deserves the sale. Price appears without the landed total. Delivery promise hides below the fold. Tabby and Tamara logos sit at checkout instead of beside the price where affordability gets decided. Our PDP teardown in the Shopify PDP optimization guide shows the hierarchy that holds: product clarity first, then value, then trust, then the action. Most pages lead with lifestyle and hope.
Leak 3: the checkout abyss. Shopify Research analysis of more than 100 million checkout sessions found one page checkout cuts abandonment by 21 percent versus multi step flows. Yet Baymard attributes 24 percent of abandonment to forced account creation and 18 percent to long processes. In UAE stores the local variant decides the outcome. Guest checkout hidden behind a login wall, cash on delivery buried inside an accordion, wallets placed below the manual card form where 14 percent of eligible users ever scroll. One Dubai home goods store showed free delivery on the product page, then added a COD fee at the final step. Payment step exits hit 64 percent over 21 days. The buyers were not price sensitive. They were trust sensitive, and the total surprised them at the worst moment.
For benchmarks by niche and device, see our Shopify conversion benchmarks. When the drop clusters at payment, the Shopify checkout optimization guide is the companion fix list.
Why is CRO margin insurance, not experimentation?
Because experiments end. Insurance pays every month.
The standard view treats CRO as a growth experiment. Run a test on button color, read the result, move on. That view misses the commercial mechanism. Every leak you seal raises revenue per session across all channels at once: Meta, Google, TikTok, organic, email. One fix taxes every visitor a little less. No media buyer can give you that breadth, because no media buyer touches the denominator.
Consider the alternative founders actually buy. A 20 percent traffic increase at flat conversion grows cost by 20 percent and revenue by 20 percent, while margin rate stays stuck. A 1 point conversion lift on the same traffic grows revenue without growing spend, so margin rate expands. The first path needs the auction to cooperate. The second path works in any auction.
This is also an outbidding strategy. When your store turns clicks into customers at twice the competitor rate, your allowable CAC doubles. You bid where they cannot follow, not because your pockets are deeper, but because your bucket holds water. Littledata benchmarking across 2,100 Shopify stores found sites with total blocking time under 200ms carried median mobile conversion 34 percent higher than sites above 600ms. Speed alone can be the bid advantage, before copy changes anything.
A note on honesty, since causality gets abused in this industry. When revenue rises after fixes ship, we report the movement with its context: what else changed in traffic mix, promotions, pricing, and season. "Following the sprint, monthly run rate moved from X toward Y" survives scrutiny. "Our redesign grew revenue 70 percent" usually does not. Insist on that standard from any partner, including us. For what CRO actually covers as a discipline, read what CRO is and how it applies.
How do you patch the bucket in the order that pays?
Fix high intent friction first. Polish headlines last.
Our operating rule is direct: find the highest friction, form a testable hypothesis, ship the smallest useful change, measure, repeat. Diagnosis before design. In practice the sequence that pays for GCC stores runs like this.
Weeks 1 to 2: the buy viewport. Compress the hero image under 200KB, defer review and upsell scripts below the fold, and make price plus the buy button interactive fast. Google Research and Deloitte studied 37 retail sites across 11 million sessions and found each 0.1 second of mobile speed improvement lifted retail conversion by 8.4 percent. One UAE fragrance store cut largest contentful paint from 3.6 to 1.9 seconds and watched mobile conversion move from 0.74 to 1.38 percent in 21 days with no offer change. Perceived speed of the buy area predicts completion better than the overall score, a point CXL Institute research has made for years.
Weeks 3 to 4: the thumb zone. Move the variant selector and add to cart into the lower 40 percent of the viewport, enforce 48 pixel minimum tap targets with real spacing, and keep a sticky add to cart visible from first scroll. Record 100 mobile sessions with tap capture, filter for rage taps, and push the dead tap rate below 2 percent. One Dubai fashion store sat at 1.12 percent mobile against 2.44 percent desktop because its 32 pixel size selector sat outside thumb reach. After the move to 48 pixels plus a persistent sticky bar, mobile reached 1.71 percent in 29 days. For the full diagnostic, use our mobile conversion diagnostic.
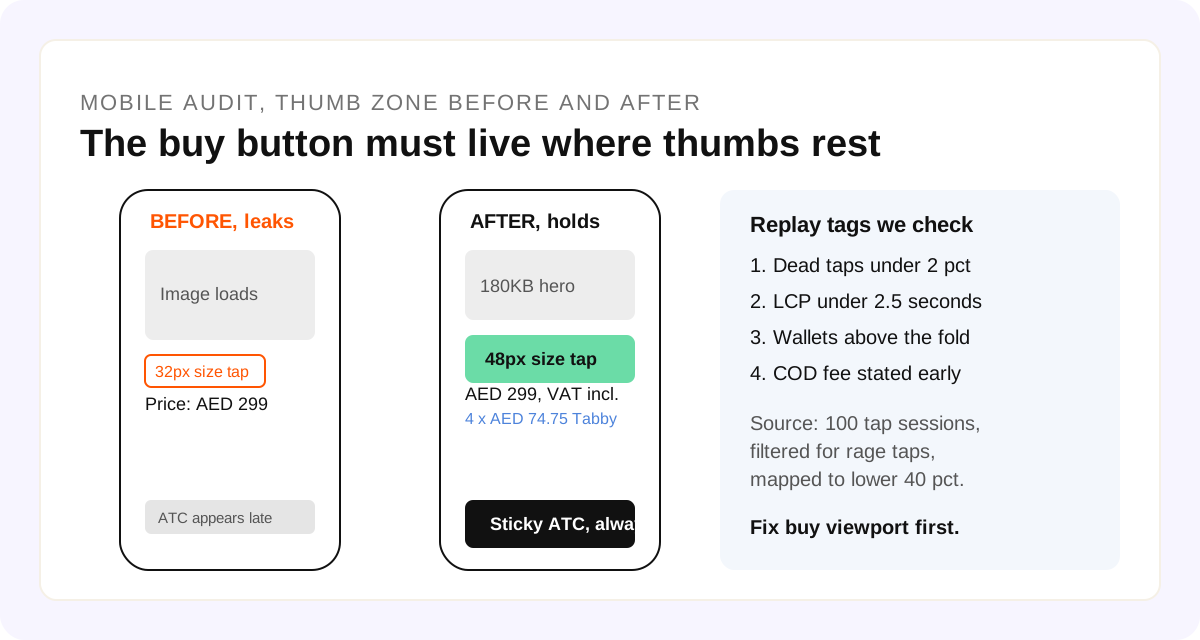
Weeks 5 to 6: checkout sequencing. Default to guest checkout, lift wallets above the card form, state the COD fee beside the price instead of the final step, and show Tabby and Tamara installments at the price where affordability gets decided. A UAE electronics store had already installed every wallet, yet only 14 percent of eligible users saw them because they sat below the fold. Order fixed it. Mobile checkout completion moved from 41.2 to 58.7 percent in six weeks. Form specifics live in our checkout field guide.
Weeks 7 to 8: discovery. Make collection filters sticky, preserve selections after a product page return, and print price, stock, and delivery estimate on the collection card. In 22 of our audited stores the mobile filter drawer needed two taps and reset on return, and 38 percent of mobile collection visitors never reached a second product. One Abu Dhabi apparel store fixed persistence and card information, and collection to product rate rose from 21 to 33 percent.
Only then test persuasion copy. CXL Institute analysis of 2,000 tests found usability defect tests beat copy tests by 2.1 times in median lift, because removing a blocker beats adding a motivator. Stores in our set that fixed speed and tap friction first reached their first significant win in 19 days versus 47 for stores that started with headlines. Sequence is the strategy.
Write each change as a hypothesis before shipping: because replays show dead taps on the variant selector, we believe a 48 pixel selector in the thumb zone will raise product page conversion, and we will validate it against product page conversion over 28 days. That sentence keeps teams honest.
What can you audit in 15 minutes this week?
Open your store on your phone and answer five questions.
First, can a cold visitor state your selling point after 10 seconds on the homepage? If the same line fits a competitor URL unchanged, it is wallpaper, not a Delta. Second, where does the page acknowledge doubt: shipping cost, returns, authenticity, delivery date? Cold copy with no answers is low empathy no matter how correct it reads. Third, what is the argument of the product page in one line: clarity, then value, then trust, then action? Scattered modules with no order never convert skimmers. Fourth, strip the logo mentally. Does the page still sound like someone specific? Fifth, is the landed total visible before checkout: VAT inclusive price, COD fee, delivery threshold?
Then check the three mechanical killers. Time the buy viewport on a throttled 4G connection and flag largest contentful paint above 2.5 seconds. Tap every primary button and flag anything under 48 pixels or outside thumb reach. Start a test checkout and count the fields, the logins, and the surprises. Each surprise is a leak with your logo on it.
If that list feels long, that is the point. Get a free audit and we will rank the leaks by revenue impact, starting with whether your Delta is clear. Diagnosis before design, always.
FAQ
What is the fastest way to confirm mobile is the problem, not traffic quality?
Segment conversion by device for the same source and landing page over 28 days in GA4 or Shopify analytics. In our audits mobile converts 30 to 50 percent below desktop on the same product page when phone experience is the cause. When the rates sit close together, look at offer and fit instead.
How much traffic do I need before CRO beats buying more clicks?
Less than teams assume. A directional read needs around 5,000 sessions over 14 to 28 days plus 100 session replays. An A/B read on checkout needs roughly 8,000 to 12,000 visitors per variant to detect a 15 percent lift at 95 percent confidence. Below that, ship sequential fixes and measure at the step level instead of waiting 60 days for a test to mature.
Will Shopify one page checkout fix my checkout alone?
It helps the baseline, with Shopify reporting about 21 percent lower abandonment versus multi step flows, but it cannot fix tap sizing, field order, or payment visibility. In GCC stores the remaining loss usually comes from COD behind an accordion, wallets below the fold, or phone validation that rejects numbers with a leading zero after +971. Sequence and fields still decide the outcome.
Does BNPL placement really move blended CAC?
In the GCC it does. Stores that surface Tabby and Tamara beside the price show median mobile checkout completion 18 to 23 percent higher than stores that reveal installments only at payment. Shoppers decide affordability at the price, not at the final screen. Placement is the fix, not the logo.
My speed score is 85 plus but mobile conversion still lags. What now?
Check perceived speed of the buy area, not the headline score. We have seen stores score 88 while price and add to cart stay non interactive past 2.8 seconds because a carousel loads first. Measure time to interactive for the buy viewport and the dead tap rate in replays. Littledata 2025 data showed total blocking time under 200ms predicted mobile conversion better than overall scores.